
If you’ve read this blog for long, you know my stance on the S&P 500:
Over a 100-year timeline, it’s the greatest wealth-building machine in history.
And I still believe that.
In fact, my first post on this site made a simple point: if history is any guide, you can be reasonably confident in a ~3% inflation-adjusted withdrawal rate from a diversified, stock-heavy portfolio over a long retirement.
That message hasn’t changed.
What has changed is the starting setup.
Most of us don’t invest on a 100-year timeline. We invest on a human timeline:
- 10–20 years where we’re building
- 10–20 years where we’re withdrawing
- and a handful of early retirement years that can make or break the plan
And here’s the uncomfortable truth:
Your personal outcome depends heavily on the price you pay when you start (or when you begin withdrawals).
Right now, the price looks… expensive.
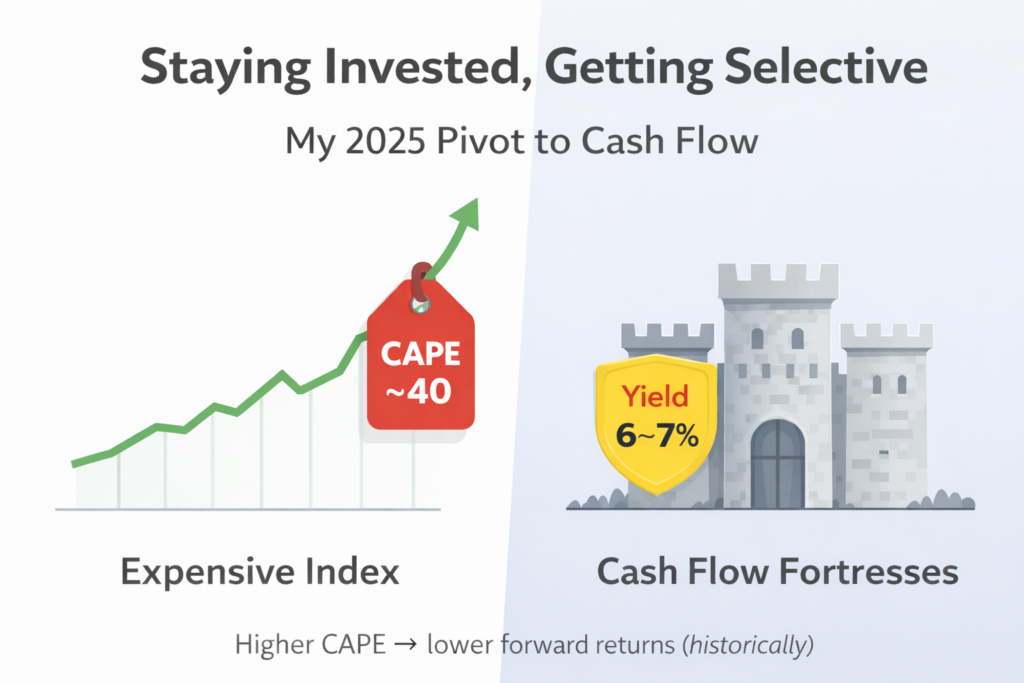
So this post is not “I’m abandoning the S&P 500.” It’s the opposite:
I’m staying invested — but getting more selective with new money in 2025 and holding some cash as dry powder. I freed up that cash primarily by trimming index funds in tax-advantaged accounts (so there was no capital-gains hit) and by directing new contributions toward cash and cash-flow holdings.
Because here’s the nuance I want to be explicit about:
- A 3% inflation-adjusted withdrawal plan can still be grounded in long-run history.
- But if you’re counting on the unusually strong returns we’ve seen in recent decades to continue from today’s valuations — or planning on materially higher withdrawals because “the market always does ~10%” — the evidence gets thinner.
That’s why I’m pivoting toward cash flow: I want more of my return to come from getting paid while I wait, and less from hoping the market stays priced for perfection.
The Chart That Changed My Thinking
Before we go further, I want to show you the single most important visual for this entire post.
It plots what you paid (Shiller CAPE valuation) on the X-axis and what you got (the next 10 years of annualized real return) on the Y-axis.
Each dot is a historical starting point. The curves show a “typical” path and a wider band of optimistic/pessimistic outcomes.
This isn’t a prophecy. It’s a historical batting average for investors starting at different valuation levels.
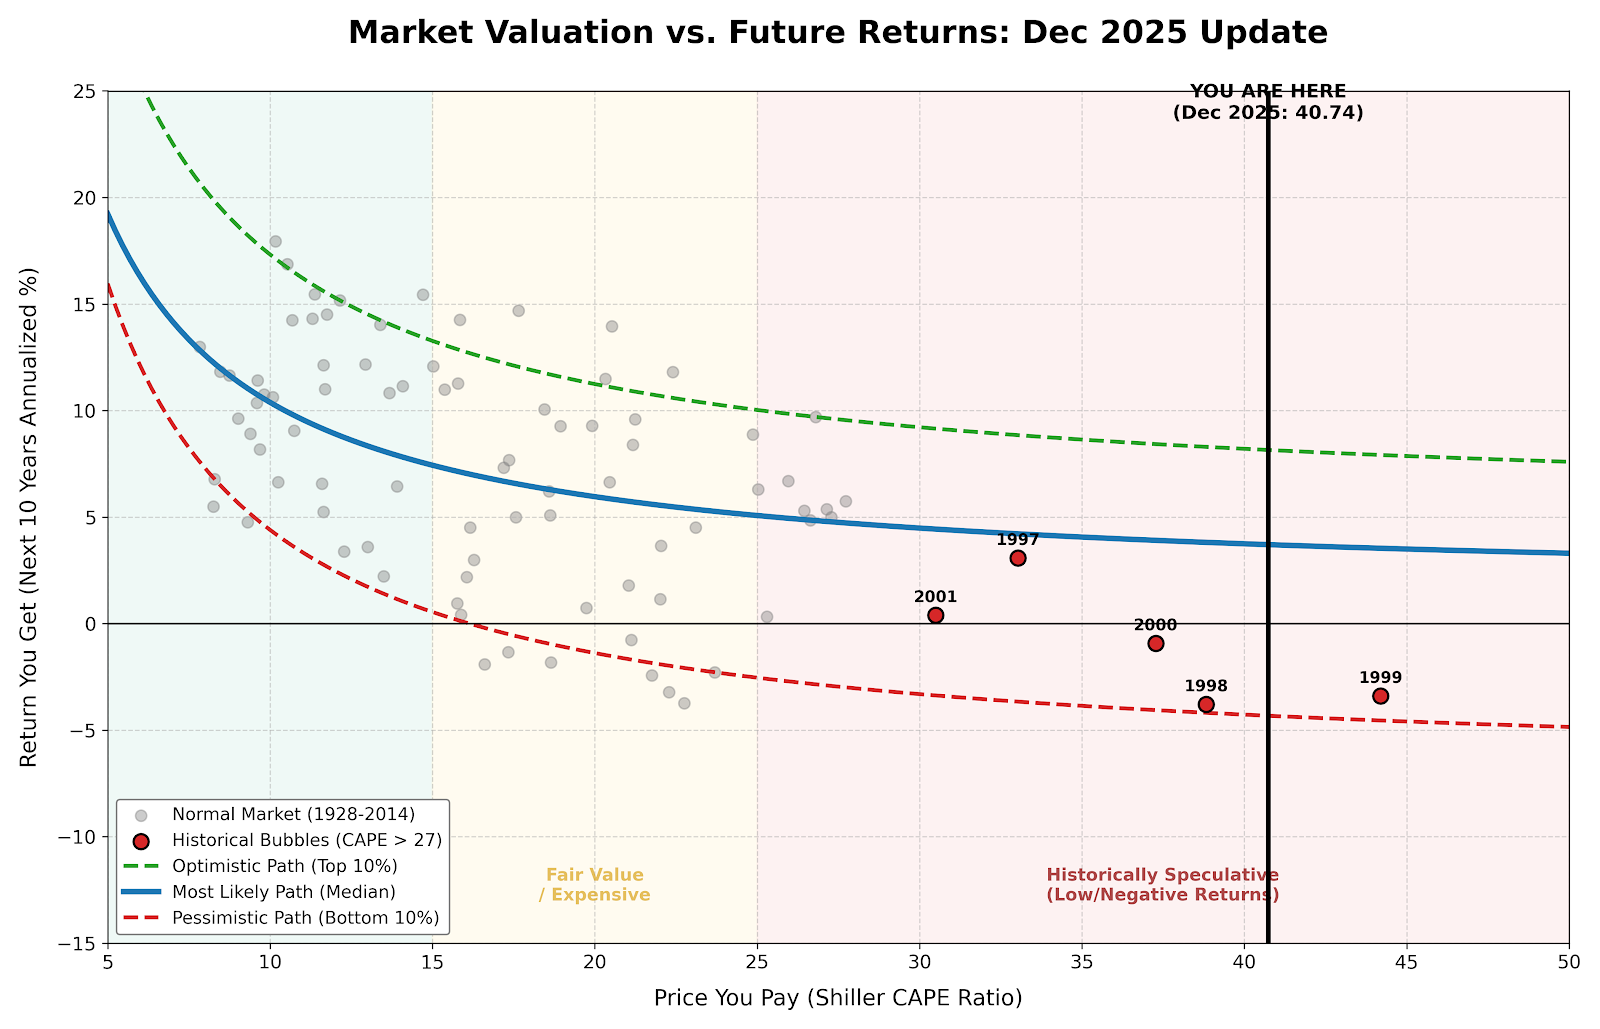
Figure: Market valuation (Shiller CAPE) vs. the next 10-year annualized real return (1928–2014). Higher starting valuations have historically been linked to lower forward returns, with wide outcomes.
What the Figure Is Saying
The figure has one message that matters more than all the curve-fitting in the world:
We’re standing in one of the rarest parts of the entire chart.
Most of the dots—the normal, everyday investing history—sit at much lower CAPE levels. The far-right tail (where CAPE is extremely high) happens only a few times per century.
And when investors did start from those rare, expensive moments, the next 10 years tended to deliver disappointing real returns.
That’s not fear-mongering. It’s just math:
As starting valuation rises, the “most likely” next 10-year real return trends lower.
If you’re 25 and auto-investing every paycheck for four decades, valuation cycles are annoying but survivable.
If you’re within 10–15 years of retirement (or already there), valuation risk can become plan risk.
This is the heart of my 2025 pivot:
I’m still invested. I’m just less willing to assume we’ll repeat the unusually strong return environment that many investors have grown used to.
The Buffett Indicator: Another “Red Light” on Valuation
CAPE isn’t the only valuation signal flashing.
The so-called “Buffett Indicator” compares total U.S. stock market value to U.S. GDP. It’s not perfect, but it’s another blunt way to ask:
“How expensive is the market relative to the size of the economy?”
In late 2025, many trackers put the Buffett Indicator above 200% — historically elevated territory.
That doesn’t force a crash.
But it’s consistent with the same message as the Figure:
future returns can be lower when the starting price is high.
The Yield Problem: Why the S&P 500 Feels Like “Negative Carry” vs Cash
In a normal world, stocks pay you more than cash because stocks are riskier.
But today, the math feels backwards.
- S&P 500 dividend yield: about ~1.15% (end of 2025)
- 3-month Treasury yield: about ~3.6% (late Dec 2025)
So you can sit in a short-term T-bill and earn roughly 3× the cash yield you get from the S&P 500’s dividends.
That doesn’t mean “cash beats stocks forever.” Rates can fall, and equities can rally.
But it does mean something important:
When markets are expensive, being patient no longer costs you 0%.
You can get paid while you wait.
That changes the “default” decision. It rewards selectivity.
Buffett’s Cash Pile: Not a Crash Call — a Discipline Signal
As of Q3 2025 reporting, Berkshire Hathaway’s cash pile was widely reported around $381.7 billion, a record level.
I’m not claiming Buffett is “calling the top.” He rarely does that.
What he’s doing is more interesting:
He’s refusing to swing at pitches he doesn’t like.
When the greatest value investor alive is happy earning Treasury yields with a massive chunk of capital, I don’t interpret that as panic.
I interpret it as valuation discipline.
The “Permission Slip” Problem (Forecasts vs. Sales Pitches)
Retail commentary is usually optimistic. That’s not because banks are evil — it’s because “stay invested” is a better message than “it might be a rough decade.”
But if you look at what major institutions publicly project for long-term U.S. equity returns right now, you’ll notice something important:
Hardly anyone is modeling “10%+ forever” as a base case.
| Institution | Forecast window | Annualized return expectation |
|---|---|---|
| Vanguard | Next 10 years | ~3.5%–5.5% (range) |
| Goldman Sachs | Next 10 years | ~6.5% (base case; scenarios vary) |
| J.P. Morgan (LTCMAs) | Long-term assumptions | ~6.7% (U.S. large cap assumption) |
Notice what’s missing: the comfortable “10%+ forever” base case.
The point isn’t that these forecasts are guaranteed (they’re not). The point is that even the big institutions — the ones that benefit when investors stay invested — are modeling a world where the next decade could plausibly be mid-single-digit returns.
And this loops back to my first post:
I still think a ~3% inflation-adjusted withdrawal plan can be grounded in long-run history. But what I’m not willing to do in 2025 is build my plan around the assumption that we’ll repeat the unusually strong returns of the last decade.
If the math is pointing to “mid-single digits” (or less), then I want more of my return to come from cash flow I can collect today, not from multiples I hope the market grants me tomorrow.
This Isn’t About Predicting a Crash
I’m not writing this because I think I can time the market.
I’m writing this because the return equation is simple:
Total return ≈ dividend yield + earnings growth + change in valuation multiple
When valuations are already very high and dividends are low, you’re implicitly betting on:
- strong earnings growth, and
- the market continuing to pay extreme multiples
That can happen. It has happened.
But at high starting valuations, the margin of safety gets thinner.
So my 2025 adjustment isn’t “sell everything.”
It’s: stay invested… but get selective.
Why “Cash Flow First” Makes More Sense Right Now
When the market is priced for perfection, I want my return to rely less on “someone paying more later” and more on “getting paid while I wait.”
That’s the pivot:
Price Appreciation First (how most people invest)
- you accept whatever valuation the market gives you
- you depend heavily on future multiple expansion
- you hope the market is generous at the moment you need it most
Cash Flow First (my 2025 tilt)
- you prioritize durable cash generation today
- you demand coverage and balance-sheet strength
- you let time work for you even if the market goes sideways
To be clear: this is not a “sell the S&P 500” manifesto.
Broad indexing is still the default best answer for most people, most of the time.
But at extreme valuations, I want to trim my broad market positions and be more selective with new capital.
What I’m Looking For: “Cash Flow Fortresses”
Here’s the checklist I’m using right now:
- Real cash coverage (not financial engineering)
- Balance sheet resilience (can survive ugly cycles)
- Shareholder alignment (owners/management have real skin in the game)
- Reasonable valuation (I refuse to pay 40× for “maybe”)
- A reason the cash keeps coming (contracts, scale, moat, pricing power)
I want businesses where the “return engine” is visible.
Not dependent on hope.
Example Fortress #1: Enterprise Products Partners (EPD)
EPD is a midstream “toll road” business. It gets paid to move and process energy products — more fee-based than “oil price lottery.”
Why it fits the framework:
- Cash coverage: the distribution is supported by real cash flow with a meaningful cushion
- Yield: you’re paid a healthy cash yield today (not promised one later)
- Alignment: meaningful insider/family ownership encourages conservative capital decisions
- Valuation: priced with skepticism while generating steady cash
Is EPD risk-free? Of course not. It lives in the energy ecosystem and it’s not immune to regulation or recessions.
But it’s the kind of asset I like when the broad market is expensive:
a business that pays me now and still retains cash after doing so.
Example Fortress #2: Exxon Mobil (XOM)
The same cash-flow logic applies to real-economy giants when they’re priced for skepticism rather than perfection.
Why XOM fits the spirit of the strategy:
- large-scale physical assets that generate real free cash flow
- a dividend policy with a long history
- balance-sheet strength designed to survive cycles
- paid-to-wait characteristics (you’re not relying solely on multiple expansion)
Energy is cyclical. That’s part of the deal.
But I’d rather own cyclical cash flow at a reasonable price than “perfect growth” at a perfect price.
The Steelman: What Could Go Wrong With My Strategy?
If you’re going to make a strong valuation argument, you should be honest about the counterpoints and risks.
Here are the real risks of “Cash Flow First”:
- CAPE isn’t perfect. The market changes, accounting changes, sector composition changes.
- Yield traps exist. High yield can be a warning sign, not a gift.
- Sector concentration risk. If you build cash flow primarily in one area (like energy), you can get correlated drawdowns.
- Opportunity cost. The market can stay expensive longer than feels rational.
That’s why my plan is tilt, not all-or-nothing.
My Practical Plan: Rules, Not Predictions
This is what I’m actually doing:
- Keep but trim my core broad-market position. I’m not trying to be a hero.
- Aim new money toward cash-flow assets with real coverage and sane valuations.
- Require a margin of safety: coverage ratio + conservative balance sheet + disciplined payout policy.
- Diversify cash flow sources so one sector doesn’t dominate the outcome.
- Stay flexible: if valuations normalize, I’ll happily shift back toward heavier indexing.
In other words: I’m not trying to guess the next headline.
I’m building a plan that works even if the next decade is just… average.
Conclusion: Staying Invested — but more selective in 2025
The Figure doesn’t say the market must crash. It says something more useful:
When you start from extreme valuations, the next decade has historically offered lower and wider-ranging outcomes.
Layer on two more facts:
- The Buffett Indicator is historically elevated, and
- T-bills yield meaningfully more than the S&P’s dividend yield today
That doesn’t force a crash.
But it does make me more selective.
So my response is boring on purpose.
I’m still invested. I still respect the long-run power of the S&P 500. And I still believe a conservative 3% inflation-adjusted withdrawal rate is a reasonable planning baseline if history is any guide.
But when starting valuations are stretched, I’m not counting on 8–10% returns as a default assumption. In 2025, I’m choosing to be more selective—trimming my broad market positions and shifting new money toward cash flow fortresses where I can buy durable cash generation at sane prices and get paid while I wait.
Disclaimer
This is not financial advice. I am just a guy with a spreadsheet. Do your own due diligence.
Start earning every time someone clicks—join now!
Start profiting from your network—sign up today!
Unlock top-tier commissions—become our affiliate partner now!