

100 % Stocks vs. an 85/15 Portfolio, 1926–2024 – Cash bucket investing
Prefer to listen? 🎧
Click here to listen to the podcast version of this guide.
Quick Recap – Why the 3 % Rule Matters
In my inaugural post, Retire with Confidence: The 3% S&P 500 Plan, I showed that a retiree withdrawing 3% (inflation-adjusted) from an all-stock S&P 500 portfolio never ran out of purchasing power over any 30-year stretch between 1928 and 2024—even if they started at the peak of 1929.
The catch? That strategy required nerves of steel, especially watching your nest egg fall to ~$30k during the Great Depression.
Enter the “Cash Cushion”
Many advisers recommend keeping a “cash cushion” in Treasury bills or other safe assets to ease those gut-wrenching market crashes. The idea is behavioral: sell stocks “high” when markets are strong to refill the bucket, then draw from cash when markets plunge.
⚡ Question: Does holding 15% cash (i.e., an 85/15 portfolio) actually reduce the pain enough to justify the cost in lost growth?
Data & Assumptions
Data source: Professor Aswath Damodaran’s annual S&P 500 total returns, 3-month T-Bill returns, and CPI inflation (1928–2024).
Two portfolios modeled:
- 100% Stocks – Sell S&P shares each January to meet the annual withdrawal.
- 85/15 Portfolio – Start each year with 15% in 3-month T-Bills. Always spend cash first. When stocks hit a new high, skim gains to refill the bucket back to 15%.
Withdrawal rates tested:
- 3.00% – The “safe” rate from the first post.
- 3.49% – The highest rate that ever hit zero for the 100% stock portfolio.
All values are inflation-adjusted and assume a $100k starting balance. I also looked at the withdrawal rate for each starting year for both the Stock and 85/15 portfolio that would bring each portfolio to zero
The Psychology of Volatility: Pain, Fees, and the Real Cost of Safety
I wanted to examine the ending portfolio value for each strategy to see what kind of generational wealth they might create. I also looked at the minimum balance experienced during the 30-year retirement period, which I think offers a good quantitative proxy for the psychological pain of volatility. After all, when I hear “volatility,” I’m not worried about the wild upswings (those are fun!). It’s the big drawdowns that keep me up at night.
The chart shows the withdrawal rate that would bring each portfolio down to zero, depending on the start year. In a strong market, the 100% stock portfolio supports slightly higher withdrawal rates. In tough stretches like 1929, the 85/15 mix comes out ahead.
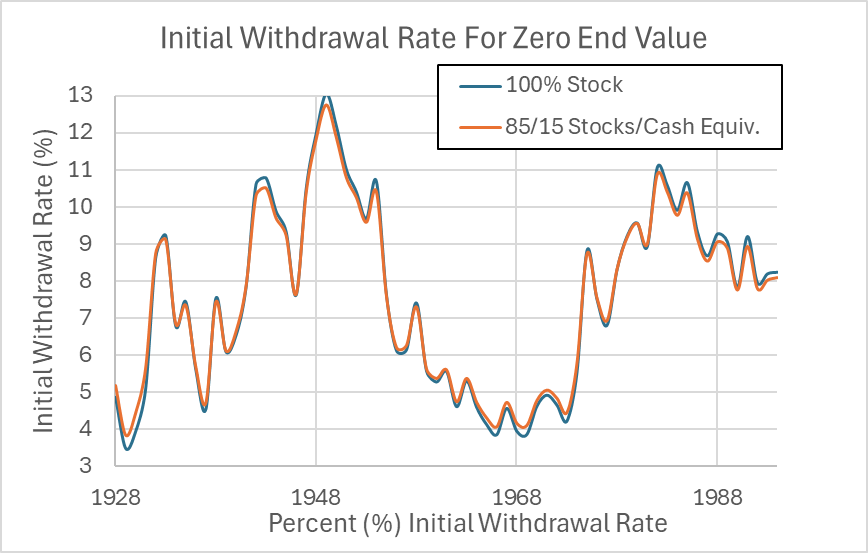
*Withdrawal rate to zero for each start year – 100% stocks vs. 85/15 portfolio*
Look closer at 1929:
- 100% stocks support a 3.49% withdrawal
- 85/15 mix supports 3.85%
That’s a 10% increase in income for that worst-case retiree (3.85 ÷ 3.49 ≈ 1.10). Not bad—but not life-changing either. You can also start to see where that almost safe 4% withdrawal rule starts to materialize from the historical data.
Now consider how much attention investors give to diversification and portfolio construction to squeeze out just 0.36 percentage points more in “safe” income. And think about this in the context of advisory fees:
- If a financial advisor charges 1% annually (not uncommon), that’s over 25% of your income in a worst-case retirement scenario.
- At a 3.85% withdrawal rate, a 1% fee takes a serious bite out of your sustainable income.
Can an advisor justify that cost? That’s for you to decide—but in tough market conditions, the math isn’t favorable. Of course, if you happen to retire into a 1949-style bull market where the safe withdrawal rate exceeds 12%, the fee may feel like a rounding error. But that’s luck, not skill.
Since we can’t go back in time to retire in 1949—and we can’t see the future—we rely on the data. The next chart flips the same analysis to show the probability of failure for a given withdrawal rate, across all rolling 30-year periods.
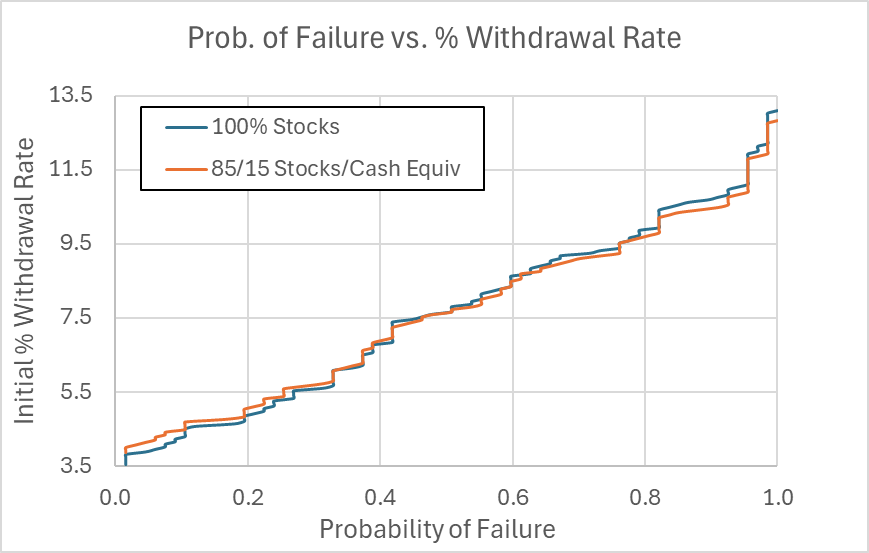
*Probability of failure by withdrawal rate – 100% stocks vs. 85/15 portfolio*
Again, the lines nearly overlap. The all-stock portfolio does slightly better in good years and slightly worse in bad ones. But in the next section, we’ll explore how this tiny difference in failure rate plays out in ending portfolio value—and that’s where things start to diverge dramatically.
Results at a 3% Withdrawal
Now let’s look at a 3% withdrawal rate and how each portfolio held up over history.
The table below summarizes the real-dollar outcomes from 1928–2024:
| Scenario | 100% S&P 500 | 85/15 (S&P + T-Bills) |
|---|---|---|
| Worst-case minimum balance | $31k | $44k |
| Median minimum balance | $90k | $89k |
| Worst-case ending balance | $83k | $99k |
| Median ending balance | $510k | $400k |
| Best-case ending balance | $1.23M | $0.83M |
The next chart shows the worst-case and median balances observed over each 30-year periods:
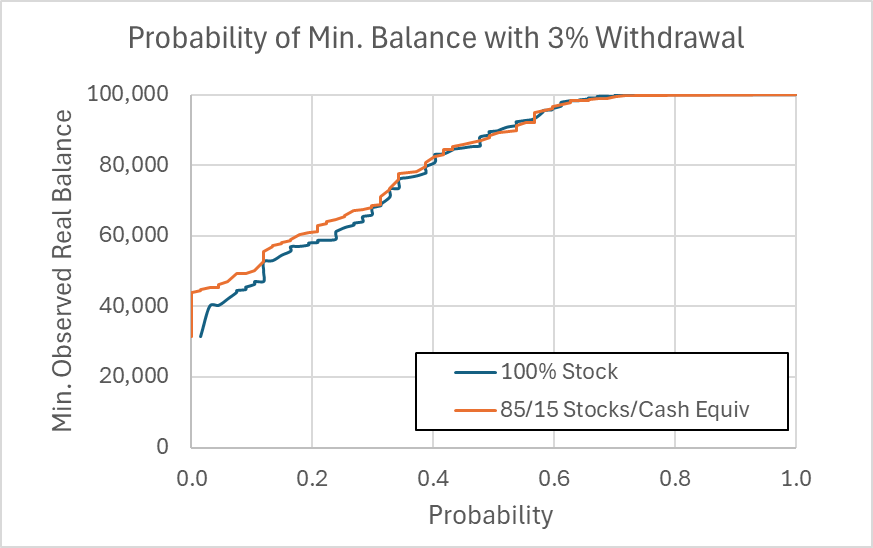
*Real worst‑case and median balance for 100 % stocks vs. 85/15 portfolios.*
In about 70% of start years, the two portfolios had similar minimum balances. But in the worst 30% of cases, the 85/15 mix cushioned the bottom slightly better—about $5k–$6k more, and $13k better in the worst-case 1929 start. Still, those losses ($31k vs. $44k) both represent gut-punch declines. I wouldn’t feel much better seeing my portfolio drop that far either way—unless that higher floor came free.
But it doesn’t. The next chart shows what that extra floor cost you in terms of ending wealth:
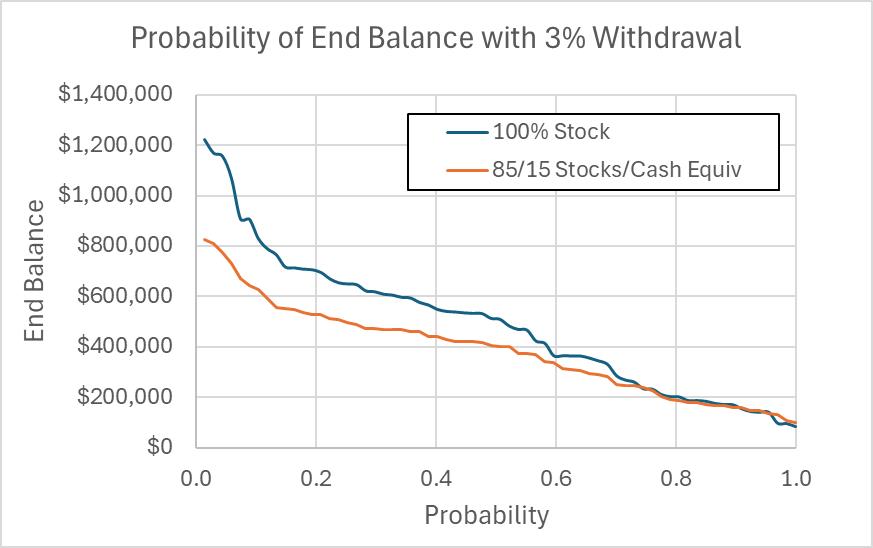
*Real end balances for 100 % stocks vs. 85/15 portfolios.*
In about 20% of scenarios, both portfolios ended near the same ($100k to $200k). But in the other 80%, the all-stock strategy often pulled ahead—sometimes dramatically.
In nearly half the cases, the stock portfolio finished at least $100k higher, and in the best-case scenario, more than $400k higher. That’s not just a paper gain—it’s an extra lifetime’s worth of nest egg in real, inflation-adjusted terms.
When framed this way, the 85/15 portfolio starts to look like it’s trading away generational wealth for marginal peace of mind.
Take‑aways
- The cash bucket softens the very worst drawdown (‑57 % vs. ‑69 %), but you still watch over half your wealth disappear if you retire into a 1929‑style crash.
- In ~50 % of historical start dates, all‑stock ends with at least $100 k more than the 85/15 mix.
- Both portfolios kept purchasing power for 30 years, but the cash slice trimmed median ending wealth by roughly 22 %.
What Happens If You Push the Limit? Testing 3.5%
Now let’s push to a 3.49% withdrawal rate—the highest that bought a 100% stock portfolio to near zero.
Here’s how each portfolio performed:
| Scenario | 100% S&P 500 | 85/15 |
| Worst-case minimum balance | $1k | $32k |
| Median minimum balance | $88k | $86k |
| Worst-case ending balance | $1k | $65k |
| Median ending balance | $447k | $372k |
| Best-case ending balance | $1.15M | $0.78M |
As before, the first chart shows the minimum balance across each 30-year period:
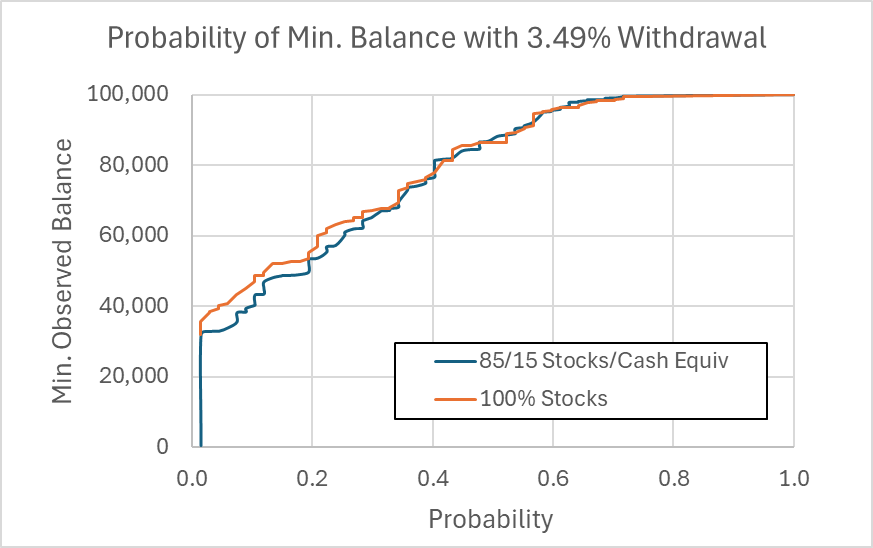
*A 15 % cash sleeve cushions the Great Depression drawdown but doesn’t change the story elsewhere.*
The 85/15 mix kept a modest cushion in the Great Depression case—a $32k floor vs. just $1k in stocks. But otherwise, the cash cushion didn’t help much.
Then we look at the ending wealth across all scenarios:
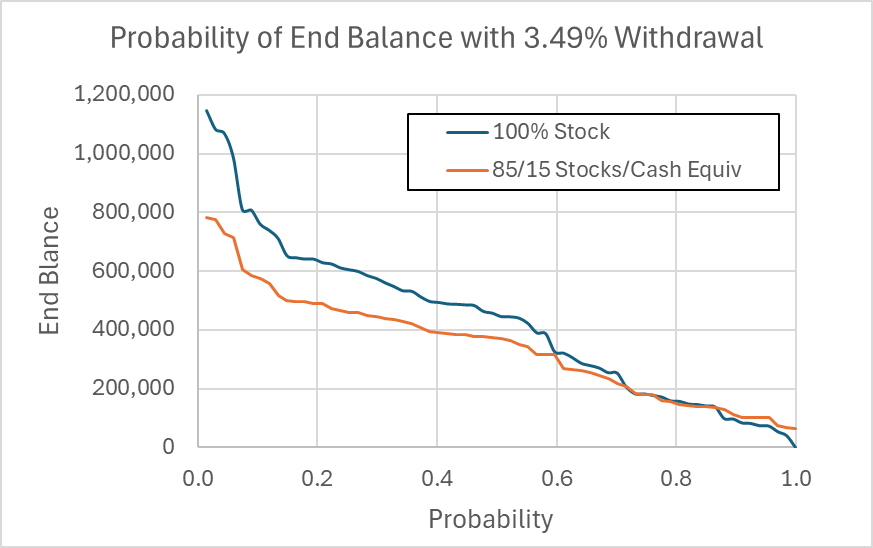
*Even at a 3.5 % withdrawal, 100 % stocks led to higher ending balances in most periods.*
The all-stock portfolio again pulls ahead in the majority of start years—particularly beyond the median. The 85/15 mix lags by $300k–$400k in the best scenarios.
Interpretation:
- A 3.5% drawdown risks draining a 100% stock portfolio to near-zero if you retire at a market peak like 1929.
- The 85/15 approach adds a modest buffer—but gives up meaningful upside in 70%+ of histories.
- In other words, it buys you a bit more certainty and gives up a lot more wealth.
Translation: Holding 15 % cash buys you ~0.35 percentage‑points more initial income before flirting with failure—but still slashes best‑case wealth by **$300–400 k**.
The Tradeoff: A Cushion or a Compromise?
Let’s recap the tradeoffs you’re making with a 15% cash bucket:
| Question | Verdict |
| Does 15% cash reduce extreme drawdowns? | ✅ Yes—from –69% to –57%. But both require iron stomachs. |
| Does it increase the “safe” withdrawal rate? | ✅ Slightly—by ~0.35 percentage points (3.5% → 3.85%). |
| What’s the opportunity cost? | ⚠️ Median nest egg shrinks 20–25%. Top outcomes give up ~$400k. |
| Bottom line | 🧠 It’s a behavioral hedge—not a free lunch. Growth is the tradeoff. |
Actionable Takeaways
- Know your risk tolerance. If a 60% drawdown would push you to sell, a modest cash sleeve may help you stay the course.
- Rebalance by rule, not emotion. Only refill the cash bucket when stocks hit new highs. That’s what preserved real purchasing power in this analysis.
- Test your own assumptions. Explore 10% or 20% cash, different rebalancing rules, or bond ladders that suit your situation.
- Consider taxes and fees. T-Bill income is taxed at ordinary rates, and advisory fees can eat into already low safe withdrawal rates.
- “Stick to the plan. Whether you’re all-in on stocks or mixing in cash, discipline is the foundation of success.”
Final Thoughts
If you have the discipline to ride out gut-wrenching volatility, a 100% stock portfolio historically delivered more wealth—often dramatically more.
But if a 60% drawdown would push you to panic, a small cash cushion may be the behavioral tool that keeps you invested.
The numbers say stocks win. But in real life, behavior often beats math—if it keeps you from selling low.
— Post by A Man of the Numbers. For more retirement simulations and investing analysis, visit amanofthenumbers.com.
Note: All results are historical and hypothetical. This is not financial advice.
zuaszq
https://shorturl.fm/lpXyl
https://shorturl.fm/Rkb8d
https://shorturl.fm/SnVvH
https://shorturl.fm/N0oL6
https://shorturl.fm/XagNe
https://shorturl.fm/Vl8F7