
So, you’ve finally built up some cash. Maybe it’s for your kids—still minors, but you’re thinking ahead. Or maybe you’re eyeing that dream retirement home: something on the Atlantic side in the Keys or perched along the Kona Coast with views that could melt stress like a lava flow.
Now comes the hard question: What do you do with the money while you wait?
You’ve probably seen my post on inflation’s erosion of purchasing power and maybe even my recent analysis on why homes aren’t the best wealth builders. So you know the risks of just sitting in cash—or rushing into a purchase before you’re ready.
But what *should* you do? Roll the dice with the S&P 500? Or keep things ‘safe’ in cash?
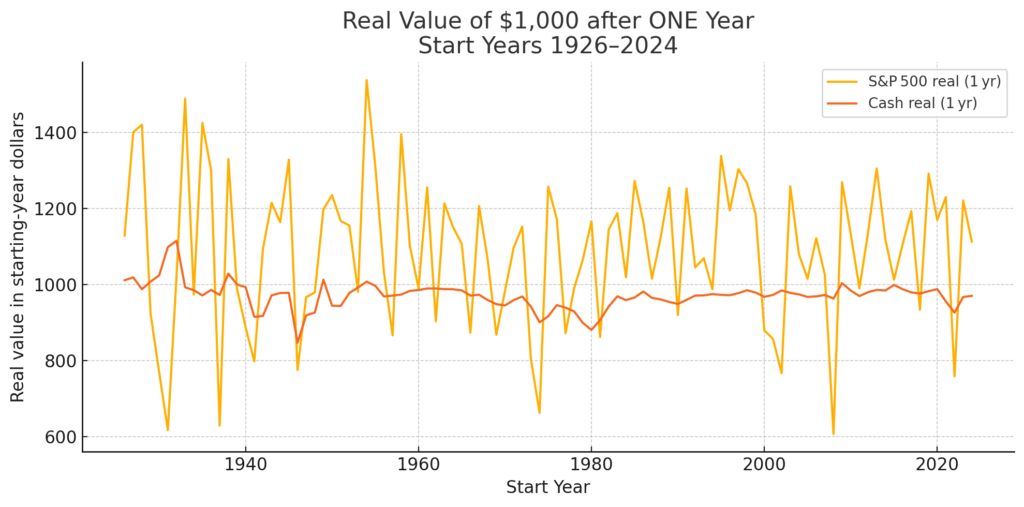
The answer depends on how long you’ve got before you need the money. So, I dug into the numbers—specifically, how different asset classes performed in real (inflation-adjusted) terms across 1, 5, 10, 15, 20, and 30-year periods. The charts below show the real value of $1000 invested in cash, S&P 500, and T-Bills over the various time periods starting in every year from 1926 to present.
Let’s see what the data tells us.
1-Year: Cash Feels Safer—and It Usually Is
Over a 1-year horizon, the S&P 500 is a rollercoaster. Some years saw 20%+ gains, but there were multiple years with 30%+ real losses. The worst single-year real return for the S&P 500 was -43.3% (1931). Of course, stocks could swing wildly positive or negative in any given year—while cash was a slow, steady loser. The worst cash year? 1946 with a -18% hit, and 2022 wasn’t far behind at -7%.
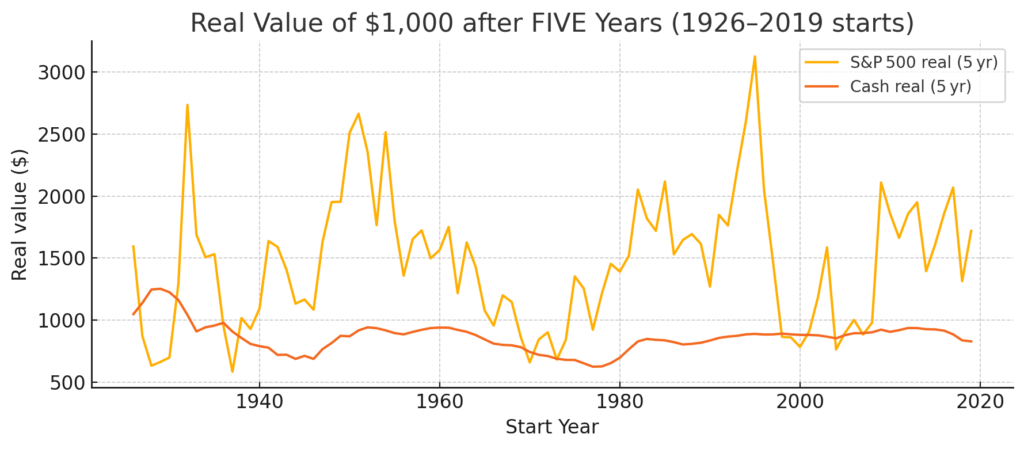
5-Year: The Turning Point
This is where the tide turns. The S&P 500 still had some down periods (e.g., Great Depression), but most 5-year periods delivered solid gains. Standout periods like the mid-1990s nearly tripled your real purchasing power. Cash, meanwhile, continued to decay—losses ranged from 6% to 37% over any 5-year window. The message: risk exists in stocks, but certainty exists in cash—and that certainty is of loss.
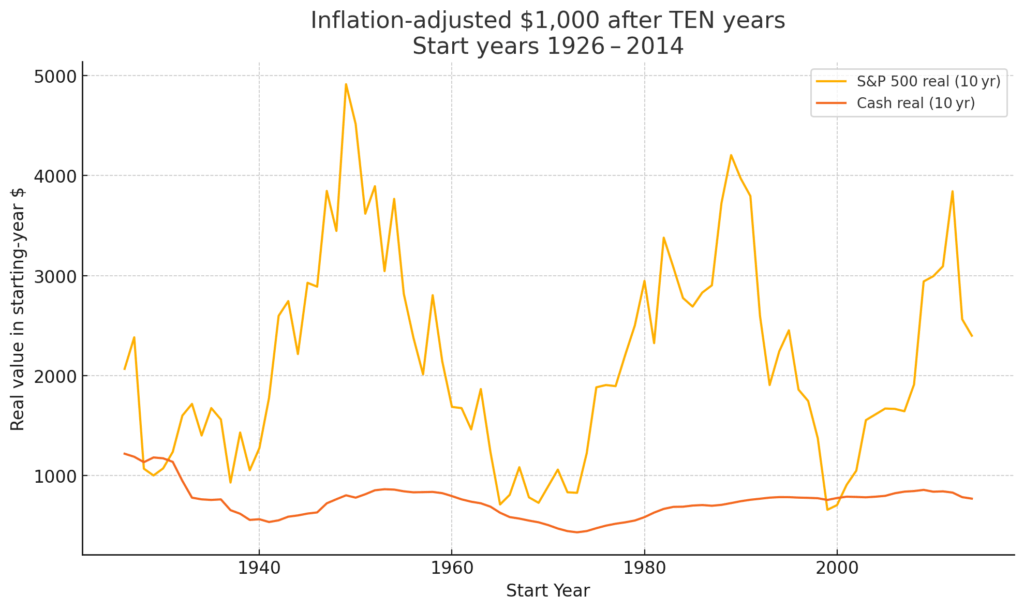
10-Year: Now It’s Not Even Close
Stocks now win nearly every time. The only notable exceptions came after extreme overvaluations—like 1999 and 2000. Meanwhile, cash’s decline became even more pronounced. The 1972 saver lost 56% of their purchasing power after 10 years in cash. Others routinely saw 15–30% real losses. At this point, not investing is what looks risky.
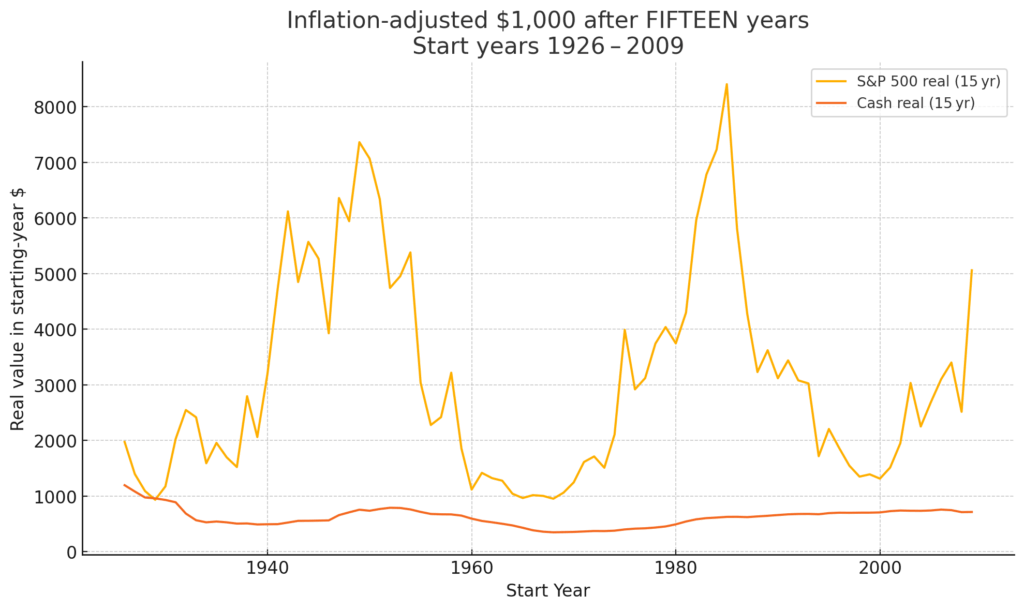
15-Year Horizon: Reliable Growth from Stocks
By 15 years, the S&P 500 becomes extremely reliable. It beat cash in every period except 1929, and even then it tied. Growth was massive: many periods doubled, quadrupled, or even octupled your money. Cash, however, delivered consistent losses—the longer you held it, the more damage inflation did.
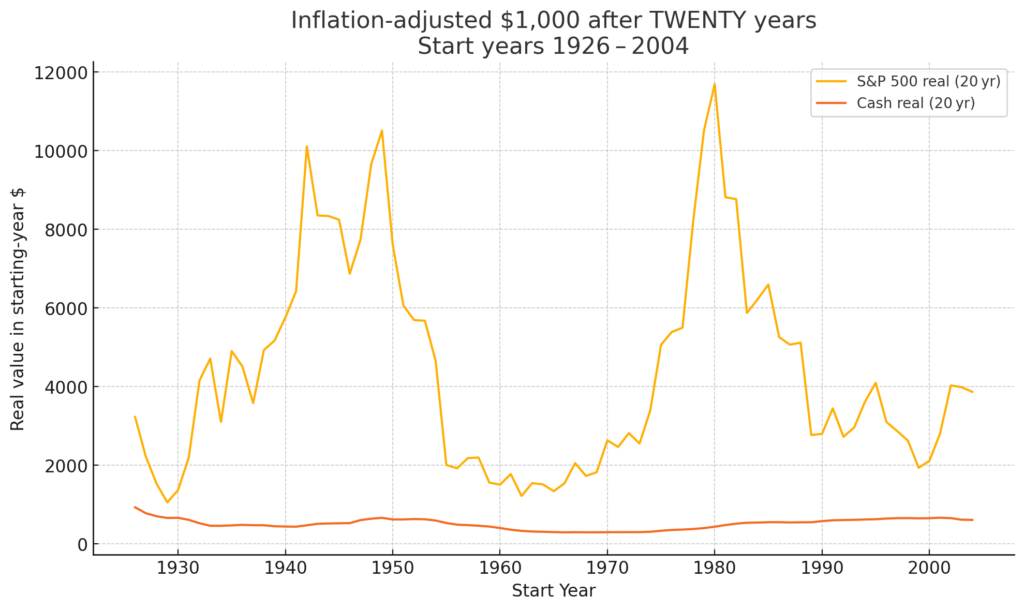
20-Year Horizon: The Power of Compounding
The 20-year view further amplifies the case for equities. Stocks compounded wealth substantially, even in periods with recessions. Cash, by contrast, faded deeper into negative territory. If you held onto cash this long, you were guaranteed to lose.
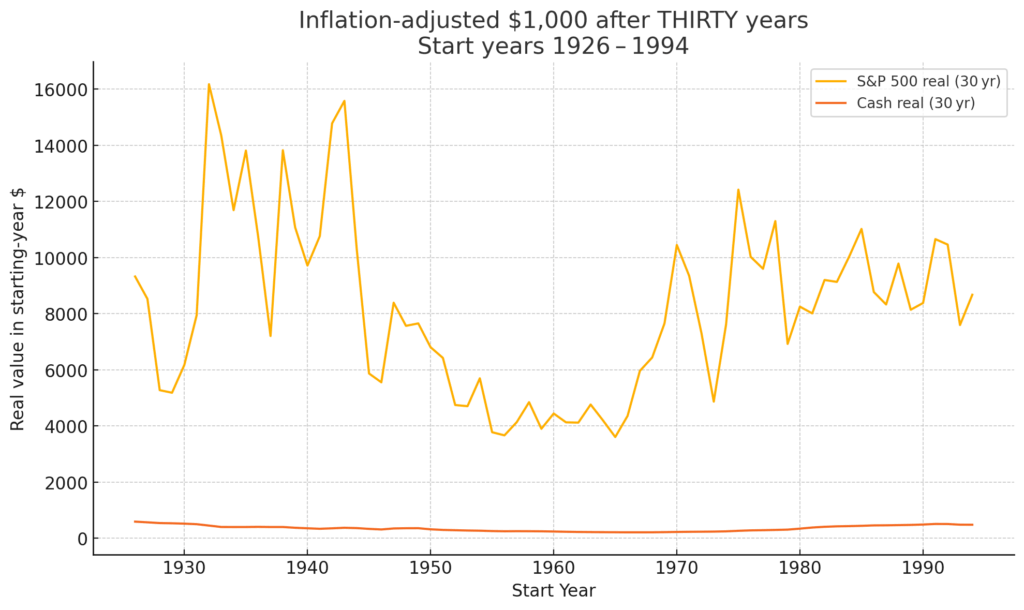
30-Year Horizon: Cash is Crushed
The data is brutal. Over 30 years, the worst real return from the S&P 500 still quadrupled your purchasing power. In many periods, investors saw 12x to 16x real gains. Cash? It lost between 41% and 79% of its purchasing power. Inflation doesn’t just nibble—it devours.
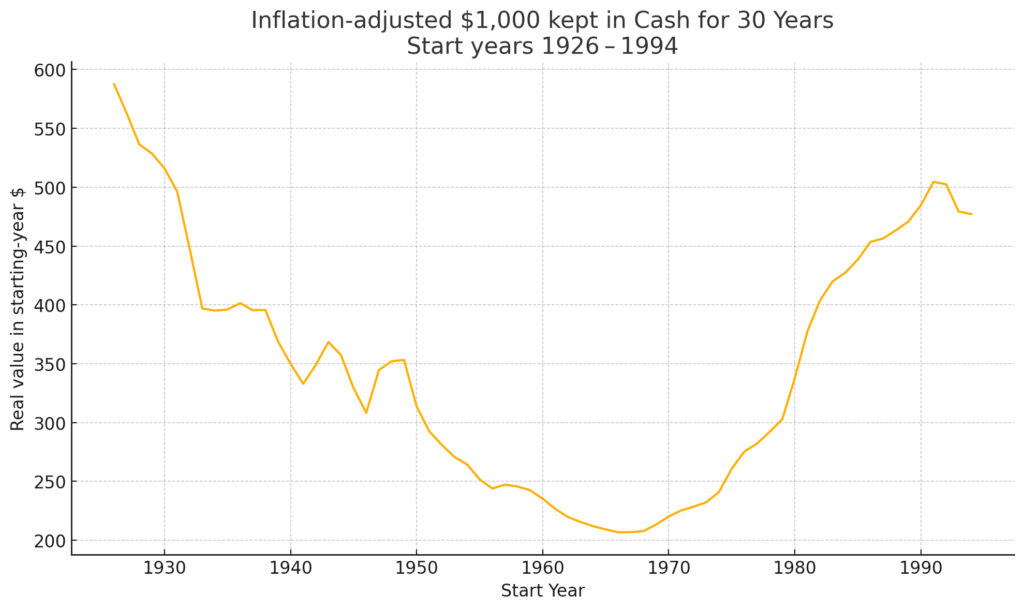
Zoomed In: Cash’s 30-Year Meltdown
Here’s a closer look at cash’s destruction over 30 years. Starting in the mid-60s was especially rough—savers from 1966 or 1967 lost up to 79% of their purchasing power over three decades. This is what happens when your money earns nothing while inflation compounds against you.
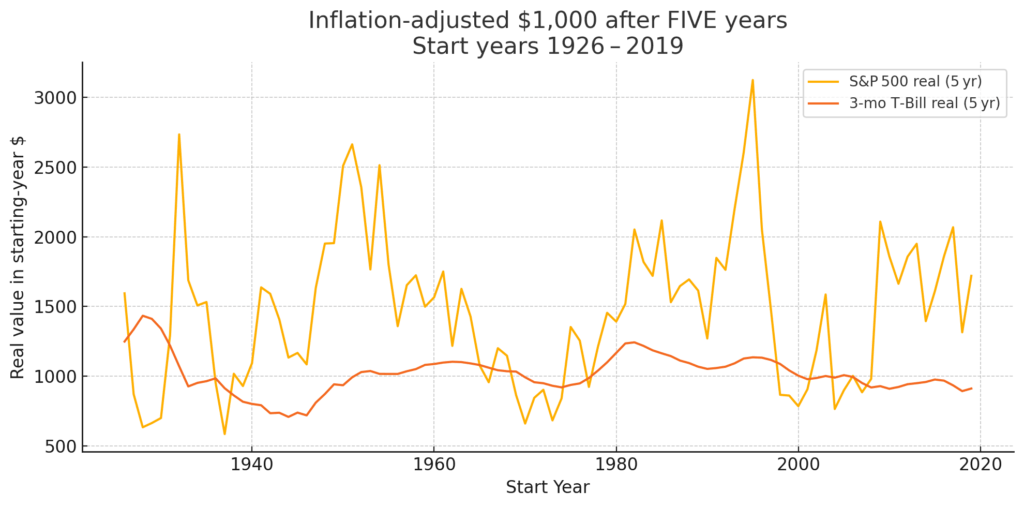
T-Bills vs. S&P 500 over 5 Years
Three-month T-bills do better than cash, but they’re still not reliable long-term. Over 5 years, T-bills often failed to beat inflation—losing up to 26% in purchasing power (e.g., 1945). Meanwhile, the S&P 500 showed strong upside in many 5-year windows. T-bills are less volatile, but also far less rewarding.
Real People, Real Decisions
Let me bring it back to two people I know:
– My cousin is saving for his kids—he won’t touch that money for 10+ years.
– A friend is 10 years from retirement and doesn’t want to lose ground to inflation.
For both of them, the answer is becoming clear.
Time Horizon Summary
| Time Horizon | Cash | T-Bills | S&P 500 |
| < 1 Year | ✅ | ✅ | ❌ |
| 5 Years | ❌ | ⚠️ | ✅ |
| 10+ Years | ❌ | ❌ | ✅✅✅ |
The Takeaway: 5 Years is the New Threshold
The old saying was: “Don’t invest in the market unless you can leave the money untouched for 10 years.”
But the numbers show that five years is already a strong tipping point. The risk of short-term losses is still there—but so is meaningful upside. And beyond that, the case becomes undeniable.
So, if you have a long time horizon, unless you truly hate your money—or just love watching it shrink—ditch the cash, skip the T-bills, and start letting time work for you. If you really need the money in less than five years, and you can’t stomach the risk of losses, T-bills might be the best option for you.
If you enjoy this blog, subscribe below to be the first to know when new blogs post!
Disclaimer: This content is for informational purposes only and should not be considered financial advice. Always consult with a professional before making financial decisions.
I think it would be interesting to test 2 years and 3 years cash vs the market. My read of the 1 year chart is that cash only wins 18 years out of the 98 years tested which is not a slam dunk in my book.